Creating Charts on Your ZX81 Couldn’t Be More Simple
Enter in a title, some data, and you can create a simple bar chart on your ZX81.
As usual, I procrastinated a bit in finishing my ZX81 program for November. Between holidays, work, and NaNoWriMo, I didn’t get around to it until this last weekend. I decided to try something a little different for this month’s program. The program itself, Charts, is a simple line graph plotter—spelling and bugs galore. As interesting as that program is, the real story is how I entered it.
A different workflow, sort of.
Coming out of my failure last month, I decided to shortcut the whole ordeal this month. After digging through my programs, I decided on a program with limited graphics. This was on purpose. I wanted a program I could type quickly into a text editor. Well, in this case a text box in JSZeddy. This time, I skipped the whole entering the program in a ZX81 emulator and, well, entered it into an editor.
The advantage was I could type the program using real and responsive keyboard. The ZX81 was never a typing powerhouse, lacking horsepower and that whole slow mode. But my Mac, even 7 years old, is great for that. The hardest part, of all things, was entering in some the few graphic characters that were in the listing. Funny enough, I had to go search for the character set. Sadly, I don’t have the hex codes memorized.
Funny enough, it worked very well. In no time, I had a program that ran. I did some quick testing and a few tweaks. But otherwise, it was the same as my listing. I panicked for a bit when I noticed the hex wasn’t filled out. Running the autosave fixed that issue. Once I had the hex code, I did what I did last time! I copied it into a file, ran my hex2bin.pl program and voilà!
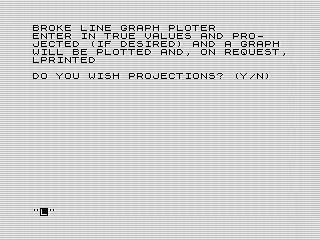 Charts, ZX81 Starting Screenshot by Steven Reid, 2020
Making pictures.
As much as I want not to, I still had to run EightyOne. To my tastes, the screenshots from it look better than my other options. Unfortunately, my VirtualBox stopped working. Ugh. Apparently my upgrade to Big Sur required some new extensions. After updating to the latest version of VirtualBox, and crashing a few times, I figured out what I missed. I approved the extensions and rebooted. With Windows working, I could get back to work.
First, I ran Charts a few more times. Mostly this was so I could enter in data for the print out. For my example, I used some iPhones sales data I found online. Entering data in Charts is a bit of a pain The verbiage I used doesn’t match what I use today. Using say X or Y axis would have made more sense.
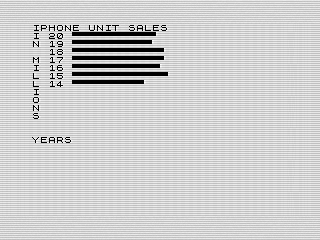 Charts, ZX81 Screenshot of iPhone Data by Steven Reid, 2020
The other program I had was that Charts doesn’t normalize the data. The first time I entered in the data, I got an out of bounds error. The PLOT I used was off the screen. I ran the program again, this time dividing by ten to keep the data on the screen. Although that worked, it would be an easy change in the program.
The display is also a bit of a pain. I only print four characters of the entry. Also, that entry is right against the left axis title. Although the effect is cool, printing the text horizontal, it really needed to be spaced out. To compensate, I added a space, which further reduced what would display. Given he size constraint, I used the last two digits of the year, creating a nice display.
Which brings me the unit’s title. It is printed at the bottom of the screen instead of closer to the data. Again, not sure why I didn’t adjust this based on location. Granted, I was a teenager and had little knowledge of data visualization and presentation. But still? I mean, it looks weird. But, hey, it was on a computer. Everything was cool to me back then.
I should note that there is a bug in the code. The projections code doesn’t seem to work. To be honest, I didn’t perform extensive testing. It could be that I did something wrong, but the display didn’t match the data I entered. Moving on to other things, like writing this article, I decided to leave the debugging for another day.
Finishing things up.
After grabbing a few screenshots, it was time to finish up a few things. First, I saved the program as a TZX file, which some other emulators used. I converted the screenshots into PNG files. After minifying them, I then uploaded them into my site. I create a little description file and then archived everything. The P and ZIP files then get uploaded, I update the database, and a ZX81 program from 30 years ago is now on my website.
I’ve already talked about Charts, so let me share a bit about how I write my articles. Funny enough, it isn’t as straightforward as you might believe. My first step was is to write the article. I use Scrivener as my editor, which is a great writing tool. I organize all my articles and can snapshot the different versions I write.
Once done, I typically load it into Hemingway Editor. I find it does a great job of telling me how hackneyed my writing is and correcting it. I tend to use a lot of passive tense and adverbs. Something Hemeingway tells me not to do. With that done, I dump the text into my website and add in the metadata, images, and other things needed. Yet, I’m not quite done.
The last step, or in this case the first one, is to write the title. A long time ago, I ran across an article about how to write better headlines. This led me to CoSchedule's Headline Analyzer. I find it useful for improving from the generic headlines I used to write to something interesting. They aren’t perfect, and don’t always score well, but they are better. Afterwards, I capitalize them correctly using an online tool. You can search to find a couple of good ones. I tend to bounce between them.
With that done, I publish my article. It seems like a lot, but it actually isn’t any different from the normal process most editors go through. From draft to final, these are the tools I use to get there. You could use others, there are plenty. This is what I do and I find it works well. That said, I’m always looking for new ways to do things. My workflow is never complete.
Until next tomorrow, enjoy this month’s ZX81 program.