How to Make a Bar Chart on Your ZX81
Even 37 years ago, the simple ZX81 could do some useful things. For instance, make a bar graph.
 Taking a turn from games, March's program is a bit more useful. Although not as flexible as some modern programs, Bar Graph does the job. Add some data and print. What could be easier? Well, a lot.
Making a bar graph or chart.
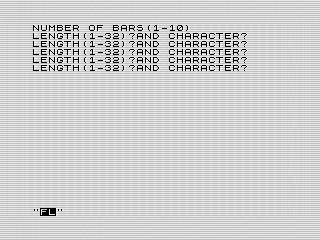
Best have your information ready. Bar Graph starts off by having you input your data. Size of graph—up to ten bars. You choose the size of each bar, from 1 to 32. Plus you can enter a description and title. Pretty straight forward so far.
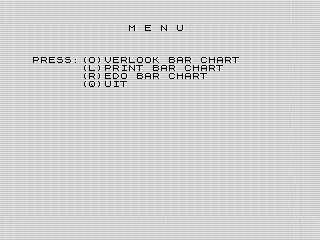
At this point, you can then review, or overlook, the bar graph. You can print it to printer. Not liking the graph? You can redo it. Or, if you’ve had enough you can quit. I recommend you give it an overlook first to make sure things look the way you want.
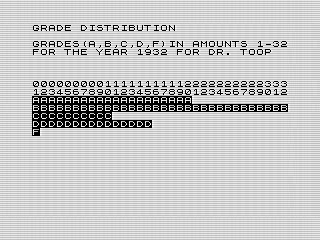 The graphs itself is simple, but functional. Title at the top, then description, and finally the graph itself. Bar Graph prints the size of the chart above the chart, from 1 to 32—the size of the screen. Although functional, it may not be easy to use. Here are some tricks to make it more useful.
Making it work for you.
The size of the bars can be a bit of a pain. Most people think in percentages, so the size of 32 can be a bit off-putting. But, you can use the ZX81 to your advantage. When it asks for the size, you can enter a formula instead. For example: "32/100*80" will print an 80% bar. You should be able to use any formula that is supposed by the ZX81. Note that the program doesn’t verify the size. So, be careful not to print too large a graph.
Although Bar Graph asks for a unit representation, you can use it as a generic description. Even more helpful, you can actually use multiple lines if you’d like. It is limited to 128 characters, or four lines. That should give you more than enough space to describe what your graph is about.
Bar Graph limits the title to a single line or 32 characters. Knowing this, I used it to center the title in one of my graphs. Count the size of the tile, subtract it from 32, then add half that in spaces to the front of the title. If only the program did that for you.
For reference, here is what a 34 year old print out with a pair of graphs looks like. Yes, that terminal printer paper is still quite useful.
![[Image]](https://farm1.staticflickr.com/809/41000022691_a1ea07aec3_h.jpg) Bar Graph by Steven Reid, on Flickr
Bar Graph by Steven Reid, on Flickr
Room for improvement.
Although functional, I'm sure you’ve noticed it could use some work. The user interface is weak, especially the data entry part. There is no feedback on what you entered, which is a bit annoying. Tiding up the wording and display what you entered would go a long way to making it more functional.
 The other big issue is that if you mess something up, you have to input all the data again. This is annoying and not friendly. Having an option to fix portions of it would be a major improvement.
If I were writing the program today, I’d make it a single display where the graph is built as you enter the data. Using a cursor or highlighting, you could edit and see then see the results. There should be plenty of room on the screen for the graph and some menu options.
Besides, I could have programed in better features. One option hinted at earlier, I could format the title. Adding an option to center, invert characters, and so on would make Bar Graph more intuitive. Another option would be to allow you to set a scale for the bars. This would remove the need for you to enter a formula.
I could go on, but you get the picture. Bar Chart is a great first effort, but could use some design love.
Cleaning up the code.
The code itself isn’t bad. Data is stored in some string variables. To limit the size of the title and description, I used a DIM statement. For example, I used DIM R$(12😎 to prevent the description from being longer than 128 characters. To be honest, I don’t remember doing that before.
The data entry section is a series of prints and INPUT commands. I’m not sure why I used a string input for the bar data. I think I intended to save the graphs in the string, but ended up doing it a different way. The side effect of that decision being the ability to use a formula. When display the bar, a VAL command is used to calculate the bar size.
Both the overview and print options are identical except for the how they are displayed. The overview uses a PRINT command, whereas the print option uses LPRINT. The other difference is the print version builds the bar in string, the prints that bar to the screen.
A potential optimization would be to combine the two routines into one. Perhaps, building the screen in a variable first. Another option is to use the COPY command. This could be combined with the single screen display mentioned earlier. The downside is that Bar Graph would print extra empty lines not used on the screen.
Looking Bar Graph over, the code is straight forward and works well. It needed a little more design work to make it a great program—not just functional.